Hypothesis Testing
What it means and how to perform it.
Hypothesis testing is one of the basic things any data scientist may need to perform. It basically means what it sounds like, you test an hypothesis. Though it is simple, especially if you are using some software package for the computation. It is however, really important to understand what sort of test is sutiable for which scenario and what does the results mean. To properly understand the various techniques and the reasons for performing a certain operation for hypothesis testing requires knowledge and understanding of many statistical concepts. In this blog I will just try to describe the whole process and try to explain the thought process behind the methods.You can learn in deep about the statistical methods by going through the courses on descriptive and inferential statistics which can be found on the resources page.
What it means:By performing a hypothesis test, what we try to prove is that a given sample is significantly different from a given population. In other words the sample does not belong to the population. To clearify this point, consider the example of a drug trial. In a drug trial all the people affected by a disease that the drug is trying to cure form the population, now the new drug is a given to a randomly selected sample from the population. The drug is considered effective only if after its administration the health of the people belonging to the sample is significantly better than the rest of the population. In other words the sample is significantly different from the population.
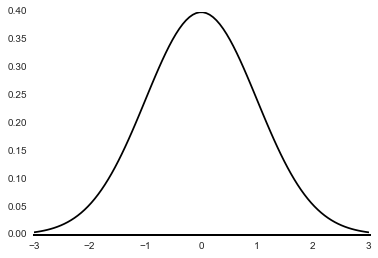
Lets look at it in another way. Suppose in the drug trial experiment earlier 100 people were chosen for the experiment. From Central Limit Theorem, we know that the distribution of sample means given that sample size is large enough will always be normaly distributed. In other words if, we draw lets say 100000 samples of size 100 from the population of people suffering from a disease and calculate the mean of their health parameters. Then the distribution of these 100000 means will be bell shaped(normally distributed), like the following figure.

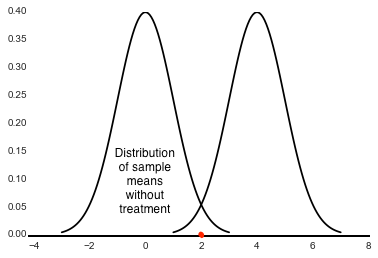
The next step would be to administer the drug to the sample set and then calculate the mean of the sample's health parameters. Now by doing a hypothesis test we need to try and prove that this red dot representing the treated sample actualy belongs to a different population (hopefully to that of the population of healthy people) with certain probabilitic certainty.

So what we will try and prove is that the mean of the treated sample does not belong to the original population but rather a different population such as the second distribution shown, with certain probabilistic certainity. If you made it this far, you already sort of understand the idea behind hypothesis testing. For the rest of the tutorial we will follow an example and understand the process and terminology related to hypothesis testing.
St. Junior high wants to test whether a new learning technique 'new better technique' is really effective in helping their students learn better or not. A rather simple way to test this would to introduce this technique to all the students and then see if their was a significant increase in student understanding of concepts. But this would really be inefficient as it could turn out that the technique had no effect at all. So they ask you an aspiring data scientist to help them out and you remember from your statistical foundation courses that hypothesis testing is what is needed here.
But before, you can get started with the analysis you need their help with the following:
- Measuring the effect:
You need a way to quantify the effect of the technique. Remember that St. Junior high just wants that their students just understand the concepts better. There are multiple ways to do this such as: you can ask teachers to rate student interaction, get students to rate their understanding of concepts, etc. To be on the safe side you ask the teachers at St. Junior high to quantify the effect and after much discussion, they agreed upon the age old student grades. - Statistical Significance:
In any kind of study be it experimental or observational, what we do is perform an experiment or give a treatment to a randomly selected subset of the total population. While random selection does provide us with some surety that average values of the measured paramters is similar to that of the actual population. But there is still a chance that subset chosen is really different from the average population. For e.g. in the St. Junior high case if the random subset selected consisted of all the top performers, then even if the new technique had no effect the results of the sample group will be significantly better than the school's average.
So there is a chance that the effect measured by you in any experiment is the result of random sample selection. To formally specify this uncertainity we decide upon significance level or α-level. A 0.05 α level means that there is 5% chance of achieving the result by random chance. In other words we are 95% sure that our result is statistically significant. Popular α values include:- 0.05, 0.01, 0.001. Remember these are just popular values, one can choose upon any significance level for his or her experiment. Coming back to the St. Junior high's problem, you deicided upon a 95% confidence interval or 0.05 α level.
Now that you have decided upon 0.05 α level, you need to set up your null and alternative hypothesis.
- Null Hypothesis (H0): The treatment did not have the desired effect, or the treated solution still belongs to original distribution
- Alternative Hypothesis (HA): The treatment had an effect. Here however we need to decide what exactly we want. Do we just want the treatment to just have an effect, or do we care wether the effect was positive or negative. If we don't whether the effect was positive or negative then we go with a two-tailed test, else we go with a one-tailed test
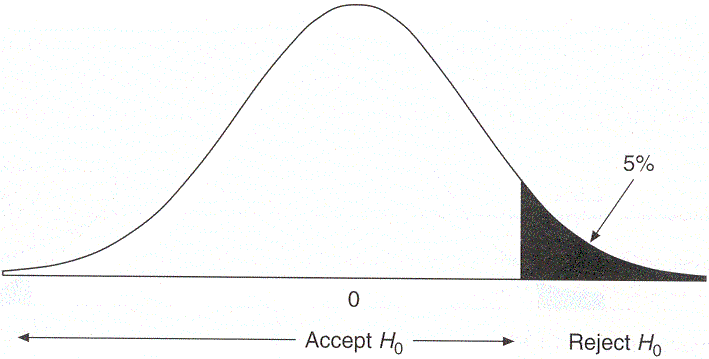
Lets now look at what I just said visually:


In a directional or one-tailed test. We would only accept the alternative hypothesis if the sample would lie in the shaded regions. We would do the same for a two-tailed test, except here the 5% area would be split equally on both the tails. As, in the case of St. Junior High school we only care if the new technique had any positive effect, we should decided to go with a positive one-tailed test.
Now that we have deicided on the significance level and our Null and Alternative hypothesis. We just need to choose which of the following tests will be be suited for this example.
- Z-Statistic: We calculate a z-score (aka, a standard score) which indicates how many standard deviations an element is from the mean. z-scores can only be used if we have information about the population parameters i.e. the mean and standard deviation.
- T-Statistic: We calculate T-Statistics in a way similar to Z-statistics. The difference between the two is that when performing t-statistics we do not need the population parameters. Also the distribution from which the significance levels are calulated is known as student's distribution rather than normal distribution. Student's distribution tends towards normal distribution for sample size >= 30
- Chi-Sqaure: Both the T-Statistic and Z-Statistic deal only with numerical values. Chi-Square test is a way to test for statistical significance in case of categorical values.
- ANOVA: ANOVA or analysis of variance in a way to measure the difference between two or samples. In other words it helps us in indentifying if in the given samples any 2 samples are significantly different from one another